Electricity sector in India
| Data | |
|---|---|
| Electricity coverage | 100%[1] |
| Continuity of supply | Urban- 23.4 hr; Rural- 22.6 hr (2023-24)[2] |
| Production | 1824 TWh (FY 2024-25)[3] |
| GHG emissions from electricity generation (FY 2023-24) | 1204.5 million tonne[4] |
| Average electricity use | 1,460 kWh per capita (FY 2024-25)[5] |
| Transmission & Distribution losses | 17.68% (FY 2022-23)[6] |
| Institutions | |
| Responsibility for regulation | Central Electricity Regulatory Commission |
| Responsibility for policy-setting | Ministry of Power |
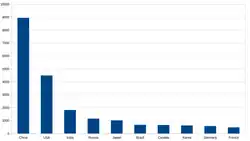
India is the third-largest producer and consumer of electricity after China and the United States, with about 6-7% share of global electricity generation.[7]
In FY 2025-26, the country's utilities generated 1840 TWh, of which 29% came from non-fossil sources.[8] As of May 2026, it met a peak demand of 270.82 GW on May 21, driven by intense and widespread heatwave conditions across the nation.[9]
Electricity in India is generated by both public and private sector utilities, transmitted through a unified national grid, and distributed primarily by state-owned distribution companies (DISCOMs).
The sector has undergone significant reforms since the Electricity Act of 2003, which introduced competition, open access, and independent regulation. Despite rapid growth in generation and transmission capacity, the distribution segment continues to face financial stress due to high technical and commercial losses, tariff constraints, and subsidy burdens.
India has also emerged as a global leader in renewable energy deployment, with renewables accounting for 95% of capacity additions in FY 2025-26.[10] The country has set ambitious targets to achieve 500 GW of non-fossil fuel capacity by 2030[11] as part of its transition toward a low-carbon energy system.
History
Electricity was first introduced in India in 1879 with the demonstration of electric light in Kolkata,[12] followed by the country's first hydroelectric power station at Darjeeling in 1897.[13] During the colonial period, electricity supply was largely developed by private companies serving urban centers and industries.
After independence in 1947, the Electricity (Supply) Act of 1948[14] established the Central Electricity Authority (CEA) for planning at central level and State Electricity Boards (SEBs) at state level. SEBs oversaw generation, transmission, and distribution within each state. The sector expanded rapidly through successive Five-Year Plans, with coal and large hydroelectric projects forming the backbone of India's power system.
However, not every state was rich in coal or hydro resources. This lead them to depend on diesel generators. In 1960s, regional grid was conceptualized to supplement power from neighboring states.
By the 1970s, REC was established to finance rural electrification. Generation was not able to keep up with growing demand. This, along with the oil price shocks lead central government to nationalize coal mines[15] and establish CIL, NTPC and NHPC.
In the 1980s, rural electrification accelerated. However, due to votebank politics by state governments, tariffs were kept low which strained their finances. In order to further develop the sector, PFC was established for financing needs.
By the 1990s, the idea of a national grid was conceptualized and lead to establishment of PGCIL. The 1991 economic liberalization led to policy reforms. It allowed private participation in generation (via licenses) and the Electricity Regulatory Commissions Act,1998 created independent regulators at central (CERC) and state level (SERC).
.svg.png)
In the 2000s, the Electricity Act, 2003 was enacted which consolidated prior legislation, mandated the unbundling of state utilities. Generation and distribution was de-licensed to encourage competition, and open access was introduced in transmission.
In the 2010s, all regional grids were fully synchronized to form a single national grid.[16] Large-scale electrification programmes such as DDUGJY and Saubhagya extended electricity access to nearly all households.[17] India also pursued renewable energy deployment goals.
In the 2020s, India continues to expand its generation capacity, with renewables making up about 87% of total capacity additions between FY 2020-21 and FY 2025-26.[18]
Installed capacity
-_Trend_%2526_Projections.svg.png)
As on March 2026, India's utilities have about 532.7 GW of installed generation capacity.[18]
As on March 2024, India's captive power plants have an installed generation capacity of 80.9 GW, with an estimated figure of 81.7 GW for FY 2024-25.[19]
As of 2025, India has the world's 3rd largest renewable energy installed capacity, the world's 3rd highest solar energy capacity, 4th highest wind energy capacity and 5th highest hydroelectric power capacity.[20][21][22]
| Type | Source | Utility
as on March 2026 |
Captive Power Plants
as on March 2024[24] |
|---|---|---|---|
| Non-renewables | Coal | 228.6 | 46.1* |
| Gas | 20.1 | 6.2 | |
| Diesel | 0.6 | 19.6 | |
| Nuclear | 8.8 | 0 | |
| Renewables | Large hydro | 51.4 | 0.1 |
| Small hydropower | 5.2 | ||
| Solar power | 150.3 | 8.9 | |
| Wind power | 56.1 | ||
| Biomass power | 10.9 | ||
| Waste-to-Power | 0.9 | ||
| Total | 532.7 | 80.9 |
*Noted as Steam (not coal) as per official documents.
Generation
India is the third-largest producer of electricity in the world. The nation's utilities produced 1840.1 TWh of power in FY 2025-26.[8]
Between FY 2014-15 and FY 2024-25, India’s electricity generation (utility only) had a CAGR of 5%.[25]
| Financial Year | Coal | Oil | Gas | Nuclear | Large Hydro | Small Hydro |
Solar | Wind | Bio | Total Utility | Total Captive[26] |
|---|---|---|---|---|---|---|---|---|---|---|---|
| 2011-12[27] | 612.5 | 2.6 | 93.3 | 32.3 | 130.5 | 51.2 | 922.5 | 134.4 | |||
| 2012-13[27] | 691.3 | 2.4 | 66.7 | 32.9 | 113.7 | 57.4 | 964.5 | 144.0 | |||
| 2013-14[27] | 745.5 | 2.0 | 44.5 | 34.2 | 134.8 | 65.5 | 1026.6 | 149.0 | |||
| 2014-15[27][28] | 835.3 | 1.6 | 41.1 | 36.1 | 129.2 | 8.1 | 4.6 | 33.8 | 15.3 | 1116.9 | 162.1 |
| 2015-16[27][28] | 896.3 | 0.4 | 47.1 | 37.4 | 121.4 | 8.4 | 7.4 | 33.0 | 17.0 | 1168.4 | 168.4 |
| 2016-17[6][28] | 944.0 | 0.4 | 49.1 | 37.9 | 122.4 | 7.7 | 13.5 | 46.0 | 14.4 | 1235.4 | 172.0 |
| 2017-18[6][28] | 986.6 | 0.3 | 50.2 | 38.3 | 126.1 | 7.7 | 25.9 | 52.7 | 15.6 | 1303.5 | 179.8 |
| 2018-19[6][29] | 1022.3 | 0.2 | 49.8 | 37.7 | 134.9 | 8.7 | 39.3 | 62.0 | 16.8 | 1371.8 | 213.1 |
| 2019-20[6][30] | 994.2 | 0.2 | 48.4 | 46.5 | 155.8 | 9.5 | 50.1 | 64.6 | 14.1 | 1383.4 | 239.6 |
| 2020-21[6][31] | 981.4 | 0.2 | 50.9 | 43.0 | 150.3 | 10.3 | 60.4 | 60.1 | 16.4 | 1373.2 | 224.8 |
| 2021-22[6][32] | 1078.6 | 0.2 | 36.0 | 47.1 | 151.6 | 10.5 | 73.4 | 68.6 | 18.3 | 1484.5 | 209.3 |
| 2022-23[6][33] | 1182.1 | 0.4 | 23.9 | 45.9 | 162.1 | 11.2 | 102.0 | 71.8 | 18.6 | 1617.9 | 211.9 |
| 2023-24[6][34] | 1294.9 | 0.4 | 31.3 | 47.9 | 134.1 | 9.5 | 116.0 | 83.4 | 17.0 | 1734.1 | 223.9 |
| 2024-25[35][36] | 1331.6 | 0.4 | 31.3 | 56.6 | 148.6 | 11.6 | 144.2 | 83.3 | 15.9 | 1824.2 | 235.1 (est) |
| 2025-26[37][38] | 1280.7 | 0.4 | 26.0 | 55.2 | 167.2 | 12.0 | 174.8 | 106.7 | 17.1 | 1840.1 | |

Notes:
- Coal includes lignite
- Large hydro includes pumped storage
- Bio = Biomass, Bagasse, and Waste to Energy
Historical datasets can be retrieved from [35].
Sources
Fossil fuels
India has huge coal reserves and as such it has been the backbone of India's electricity generation, providing base-load power. The government has indicated that coal will remain significant in the near future, and will likely peak between 2030-35.[39]
Utilization of gas plants has been limited by constrained domestic supply and high prices of imported LNG.[40] Oil-fired generation plays a negligible role, used mainly for peaking or emergency power.
Nuclear power
India operates a fleet of pressurized heavy-water reactors (PHWRs) managed by the NPCIL. The government has set a target to install 100 GW of nuclear capacity by 2047 and has initiated steps to reach 22.5 GW by 2031-32. It is also aiming to develop at least five indigenously designed and operational small modular reactors (SMRs) by 2033.[41]
Renewable energy
Renewable energy generation has doubled from 181.7 TWh in FY 2011-12[27] to 365.7 TWh in FY 2022-23.[33] However its overall share in total generation has been around 20% for the time span. This share is likely to reach 40% by 2030,[42] due to the government's target of installing 500 GW of non-fossil capacity by then.[11]
Large Hydro has historically contributed to the bulk of the renewable generation in the country, though solar – with its aggressive growth – has almost caught up with it as of FY 2024-25.[36] Wind energy has seen a relatively calm but steady growth.
Bio Energy has maintained a somewhat static generation of about 16 TWh in the past decade. However, it might increase as the government has mandated 5% biomass co-firing in Thermal Power Plants from FY 2024-25. This obligation shall increase to 7% from FY 2025-26.[43]
Storage
Energy storage systems (ESS) help in maintaining grid stability from intermittent and variable renewable energy sources and enabling round-the-clock supply of low-carbon electricity.
| Cumulative Installed (Dec 2024)[44] | Capacity Required (2026–27)[45] | Capacity Required (2031–32)[45] | |
|---|---|---|---|
| PSH | 4.8 GW | 7.5 GW / 47.7 GWh | 26.7 GW / 175.2 GWh |
| BESS | 0.1 GW | 8.7 GW / 34.7 GWh | 47.2 GW / 236.2 GWh |
| Total | 4.9 GW | 16.1 GW / 82.4 GWh | 73.9 GW / 411.4 GWh |
Due to high import costs of battery systems, India is currently relying on pumped-storage hydroelectricity. India has identified a potential PSH of 214.6 GW[46] and is planning to install at least 50 GW by FY 2030-31.[47] In 2020, power tariff from Solar PV clubbed with PSH have fallen below the coal plant tariffs in offering base load and peak load power supply.[48][49]
The government is supporting development of BESS through Viability Gap Funding. The scheme was announced in Sep 2023 and envisages development of 4 GWh of BESS projects by 2030-31.[50] Due to declining battery prices, the target was later increased to 13.2 GWh.[51]
There has been renewed interest in solar thermal because of its energy storage properties. As of 2025, India has an installed capacity of just 329.5 MW of solar thermal, out of which only 101 MW was operational.[52]
Many storage technologies like Flywheel Energy Storage, Compressed Air Storage, Green Hydrogen, etc. are in nascent stages of development.
Transmission and distribution
After electricity is generated at power plants, it is stepped up to high voltages (765 kV, 400 kV, 230 / 220 kV) for transmission over long distances with minimal loss. And then stepped down to lower voltages, closer to demand areas for power distribution to end consumers.
The national grid - which was synchronized in 2013 - consists of Inter-State (ISTS) and Intra-state Transmission System (Intra-STS) of 220 kV and above. ISTS is largely managed by Central Transmission Utility (wholly owned by PowerGrid), with private participation through Tariff Based Competitive Bidding route, with a few exceptions.[53] Intra-STS is managed by State Transmission Utility of each state. Projects are developed by State Government through competitive bidding process for projects costing above a threshold limit which are decided by the SERCs.[53]
In order to increase transmission capabilities in a cost effective way, the government often converts existing lines and substations to higher voltages.[54] Further, transmission planning has been aligned with renewable energy targets and is planned to evacuate around 613 GW of renewable capacity by 2032, including large zones in Rajasthan, Gujarat, and Andhra Pradesh.[55]
| 2017-22 Results | 2022-27 Targets | 2027-32 Plans | |
|---|---|---|---|
| Transmission Lines (circuit km) | 4,56,716 | 5,71,403 | 6,48,190 |
| Transformation capacity of substations (GVA) incl HVDC | 1104.5 | 1881.8 | 2345.1 |
Electricity distribution remains the most financially stressed part of the sector. Most distribution companies (DISCOMs) are state-owned, with private licensees operating in few areas such as Delhi and Odisha.[56] The distribution segment is characterized by high aggregate technical and commercial (AT&C) losses (excess of 30% in early 2000s,[57] 22.6% in FY 2013-14[58]) and a gap between average cost of supply (ACS) and average revenue realized (ARR).
Technical losses stem from transformation losses, line losses, poor Power Factor due to insufficient reactive compensation. Commercial losses are caused by theft, inaccurate / faulty meters, billing inefficiencies (error in billing process), and collection inefficiencies.
Govt has launched several initiatives (IPDS, UDAY, RDSS, etc) to improve the financial health and operational efficiency of DISCOMs. While there have been improvements, chronic issues like high losses, unsustainable tariffs, subsidy dependence, and regional disparities continue to affect the overall performance of the sector.
| FY 2022-23 | FY 2023-24 | FY 2024-25 | |
|---|---|---|---|
| Net Energy Sales (TWh) | 1022 | 1128 | 1214 |
| Billing Efficiency (%) | 85.9 | 86.8 | 86.9 |
| Collection Efficiency (%) | 97.4 | 97.6 | 96.5 |
| AT&C Loss (%) | 16.4 | 15.4 | 16.1 |
| ACS-ARR Gap (INR/kWh) | 0.4 | 0.6 | 0.4 |
| Outstanding Debt (INR Cr.) | 7,59,741 | 6,72,282 | 7,52,677 |
| Accumulated Losses (INR Cr.) | 6,06,277 | 6,59,340 | 6,92,269 |
Consumption

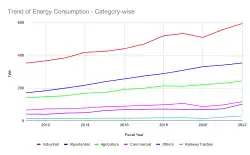
India consumed a total electrical energy of 1622 TWh in FY 2023-24, with an estimated figure of 1694 TWh for FY 2024-25.[62]
Per capita consumption reached 1395 kWh for FY 2023-24, with an estimated figure of 1538 TWh for FY 2024-25 (as of Jan 2025).[63][17] This figure is relatively low compared to the global average of 3486 kWh for 2022.[61] The nation achieved 100% household electrification as reported by its states as on March 31, 2021. Electricity connection was provided to all willing un-electrified households in rural areas and all willing poor un-electrified households in urban areas.[64]
.svg.png)
Between FY 2013-14 and FY 2024-25 (till Jan 2025), power availability has increased from 12.5 hrs to 22.6 hrs in rural areas and from 22.1 hours to 23.4 hrs in urban.[65][66]
Residential
Residential sector primarily includes use of household appliances such as air conditioners, refrigerators, fans, and other appliances. Rapid urbanization and rural electrification efforts have driven consumption. With rising global temperatures, residential demand will likely be driven by cooling needs. Steps taken by government to shape consumption includes Standards & Labeling (to help consumers identify energy-efficient products), UJALA (LED bulbs), and Go Electric Campaign (to promote electric mobility and electric cooking).
Industrial
Industrial sector encompasses manufacturing (automobiles, textiles, steel, cement), chemicals, mining, and construction. Energy-intensive industries like steel, aluminum, and cement contribute significantly to the demand. As India seeks to become a major manufacturing hub through Make in India and National Green Hydrogen Mission, the demand will likely increase in the future. Perform, Achieve and Trade scheme is the major government step to improve energy efficiency in the sector.
Commercial
The commercial sector includes areas like offices, retail establishments, malls, hotels, and restaurants. With increasing urbanization and the growth of the services sector, demand for electricity in this sector is steadily rising. Adoption of energy-efficient technologies and sustainable building practices is helping manage consumption growth.
Agriculture
Irrigation pumps are the main source of consumption in this sector. In many states, electricity for agriculture is either subsidized or provided for free, which has led to inefficiencies and high consumption levels.[67] The government has been working to reduce energy wastage in this sector by promoting solar-powered irrigation systems (PM-KUSUM) and more energy-efficient pumps (part of AgDSM), which are expected to help curb future demand.
Others
This includes municipal sector which encompasses public lighting, water works and sewage. MuDSM was launched to reduce energy consumption.
Government's efforts on improving energy efficiency across the sectors, resulted in a net energy savings of 210 TWh between FY 2011-12 and 2020-21. For FY 2020-21, 56% of overall yearly savings came from industrial sector, and 40% from residential.[45]
Foreign electricity trade
India is centrally located in South Asian region, sharing boundaries with Nepal, Bhutan, Bangladesh, and Myanmar. India and these neighboring countries have signed bilateral agreements for cross-border power transfer.[68]
- India-Bhutan (2006): The nations signed an agreement to jointly develop hydroelectric power projects in Bhutan and the transmission systems, allowing trade between the nations.
- India–Bangladesh (2010): The nations signed an MoU to established cross-border grid connectivity for power generation and transmission.
- India–Nepal (2014): The nations signed an agreement to establish cross-border grid connectivity for power exchange and trading.
- India–Myanmar (2016): The nations signed an MoU for mutually beneficial investments in R&D, consultancy, cooperation in generation and transmission in order to enhance Myanmar's power sector.
- India–Saudi Arabia (2023): The nations signed an MoU to explore connecting their electricity systems, exchange electricity during peak demand periods or emergencies. And jointly develop renewable energy and green hydrogen projects.
- India–United Arab Emirates (2024): The nations signed an MoU to develop cross-border interconnection for trade and cooperation on regulatory matters, development of green hydrogen and energy storage technologies.
- India-Sri Lanka (2025): The nations signed an MoU to develop solar projects in Sri Lanka along with cross-border interconnection for trade.[69]
| Fiscal year | Bhutan | Nepal | Bangladesh | Myanmar | ||||
|---|---|---|---|---|---|---|---|---|
| Export | Import | Export | Import | Export | Import | Export | Import | |
| 2024-25[70] | 0.9 | 5.3 | 1.6 | 2.1 | 8.1 | 0 | 0.01 | 0 |
| 2025-26[71] | 1.7 | 7.7 | 1.4 | 3.3 | 8.2 | 0 | 0.01 | 0 |
One Sun, One World, One Grid (OSOWOG): Under the International Solar Alliance, India aims to create a globally interconnected renewable-energy grid to enable cross-border transfer of solar and other clean energy, based on the principle that the sun never sets across the world.
Governance and regulatory framework
Electricity is a concurrent subject matter in the Constitution of India. As such, central and state governments can both legislate on the Indian power sector. The sector is primarily governed under the Electricity Act, 2003 and the Energy Conservation Act, 2001, which together lay out the regulatory and policy foundations for generation, transmission, distribution, and energy efficiency.
Central level
Ministry of Power is the nodal ministry which oversees the development of the electricity sector in India. It is responsible for planning, policy formulation, processing of projects for investment decisions, monitoring project implementation, training and manpower development, and the administration and enactment of legislation related to thermal and hydro power, as well as the transmission and distribution network. It is also responsible for the administration of India's Electricity Act (2003), the Energy Conservation Act (2001).[72]
Central Electricity Authority (CEA) is the technical advisory body to the Ministry, which is also responsible for data collection and dissemination, through its National Electricity Plan for a 5 year period.[73]
Ministry of New and Renewable Energy (MNRE) is the nodal ministry for the development and promotion of renewable energy technologies. MNRE facilitates research, design, development, manufacture, and deployment, setting technical standards, and aligning domestic renewable energy costs with global benchmarks.[74]
Central Electricity Regulatory Commission (CERC) is an autonomous statutory body responsible for regulating the electricity sector at the national level. It regulates the tariff of generating companies owned or controlled by the Central Government and regulates, issues licenses and determine tariff for inter-State transmission.[75]
State level
State Electricity Regulatory Commissions (SERCs) function as independent regulators at the state level, determining tariffs, issuing licenses, promoting competition, and ensuring consumer protection. They operate under the guidance of the Electricity Act, 2003, and coordinate with CERC for interstate issues.
Power Market
In the electricity market in India, power can be traded between generators, distributors and large consumers through bilateral contracts or power exchanges. Bilateral contracts are negotiated between two parties and are often for long term, providing stable prices. Power exchanges allow electricity to be traded through collective transactions, where buy and sell bids are anonymously submitted and aggregated. The market is cleared based on supply-demand equilibrium, with the intersection of the demand and supply curves determining the Market Clearing Price (MCP) and Market Clearing Volume (MCV). Power exchanges helps supplement long term arrangements, while allowing discovery of efficient prices.
India has 3 power exchanges: IEX, PXIL, HPX which offer products like Day-Ahead Market, Real-Time Market, Term-Ahead Market, etc. These exchanges are regulated by CERC and also allow trading of Renewable Energy Certificates. In FY 2024-25, out of 1692 TWh supplied, 143.7 TWh (about 8.5%) was transacted via Power Exchanges, with the balance being supplied under long-term or bilateral arrangements.[76] 8.5% is relatively small compared to countries with liberalized markets where exchanges handle a much larger share.
Multiple power exchanges create fragmentation and lead to disparate price discovery. CERC has ordered market coupling to create a single clearing price, simplifying procurement, improving cost predictability, and reducing administrative burdens for DISCOMs and industries while improving price discovery and system efficiency. The coupling would be implemented for Day-Ahead Market by Jan 2026 after a shadow pilot project was conducted which could lead to a savings of ₹1.4 crore per day.[77]
CERC would also couple other segments like Real-time Market and Term-Ahead Market after pilot runs and consultations.
Environmental Concerns

The electricity sector in India has significant environmental implications, primarily due to the continued reliance on fossil fuels, especially coal. While renewable energy capacity is expanding rapidly, coal still dominates the generation mix, contributing to high levels of air and water pollution, land degradation, and greenhouse gas emissions.
Air Pollution
Prior to 2015, thermal power plants were only required to meet the norms for particulate matter (150 mg/ Nm3 for 210 MW and above; 350 mg/ Nm3 for less than 210 MW plant), with standards set for chimney height for proper emission dispersion (220m for less than 500 MW, 275m for above 500 MW).[79]
In December 2015, MoEFCC introduced following regulations for thermal power plants.
| Installed Date | PM | SO2 | NOx | Mercury |
|---|---|---|---|---|
| Before Jan 2004 | 100 | 600 (< 500 MW) | 600 | 0.03 (≥ 500MW) |
| 200 (≥ 500 MW) | ||||
| Jan 2004 – Dec 2016 | 50 | 600 (<500 MW) | Initially: 300
Revised: 450[81] |
0.03 |
| 200 (≥ 500 MW) | ||||
| Jan 2017 onward | 30 | 100 | 100 | 0.03 |
The power plants were required to comply with these standards by Dec 2017. Due to techno-economic constraints, this timeline was later extended to 2022.[82] Due to persistent challenges related to SO2 emission compliance, in Mar 2021, MoEFCC categorized thermal plants on the basis of location and specified timelines for each.
| Categories | Location Criteria | Deadlines for non-retiring plants | Retirement deadlines for compliance exemption |
|---|---|---|---|
| Category A | Within 10 km radius of NCR or cities having 10L+ population (as per 2011 census) | Dec 2022 | Dec 2022
For SO2: Dec 2030 |
| Category B | Within 10 km radius of critically polluted areas or non-attainment cities (as per CPCB) | Dec 2023
For SO2: Dec 2023; then Dec 2025;[83] then Dec 2028;[84] then made discretionary[85] |
Dec 2025
For SO2: Dec 2030 |
| Category C | Remaining plants | Dec 2024 | Dec 2025 |
In case of non-compliance after the stipulated deadlines, an Environmental Compensation of Rs. 0.2 / unit generated will be levied for up to 180 days, Rs 0.3 / unit for 180–365 days, and Rs 0.4 / unit for beyond 365 days.[83]
Water and land impacts
Coal mining, particularly open-cast mining, leads to deforestation, land degradation, and displacement of communities in several parts of the country.
Coal-based power generation requires substantial water for cooling, which can stress local water resources, especially in water-scarce regions. Additionally, the discharge of heated water into rivers and lakes can lead to thermal pollution, affecting aquatic ecosystems. In December 2015, MoEFCC introduced following regulations for thermal power plants with a deadline of Dec 2017. However, compliance remains uneven.[86]
| Installed Date | Specific water consumption[80] |
|---|---|
| Before Jan 2017 | 3.5 m3/MWh |
| Jan 2017 onward | Initial: 2.5 m3/MWh
Revised: 3 m3/MWh[86] |
Greenhouse gas emissions

India emitted 2959 million tonnes of CO2 equivalent (excluding LULUCF) in FY 2020-21,[87] with electricity sector emitting 928.1 MT CO2,[78] contributing 31% to the total emissions.
The sector emitted 1204.5 MT CO2 in FY 2023-24, with a weighted average emission intensity of 0.703 kg CO2 / kWh of electricity generated.[78]
In its latest NDC under Paris Agreement, India aims to install 50% non-fossil fuel based generation capacity by 2030.[88] Total emissions are estimated to reach 1114 MT CO2 in FY 2029-30, with an average emission factor of 0.477 kg CO2 / kWh.[42]
Challenges
India's electricity sector faces many challenges, categorized across generation, transmission, distribution and consumption.
Generation
- Dependency on coal: Despite growth in renewables, coal remains dominant in generation, leading to air pollution and carbon emissions fueling climate change. Air pollutants scatter and absorb solar radiation which reduces the amount of light reaching solar PV. Whereas, increased temperatures reduces solar PV efficiency.[89]
Transmission and distribution
- High technical losses: Despite improvements under various government schemes, T&D loss stands at 19.2% for FY 2023-24.[90]
- High commercial losses: Poor billing efficiency (86.9% for FY 2023-24[91]), poor collection efficiency (96.5% for FY 2203-24[92]) and power theft leads to delays, cash flow problems, and loss of revenue for DISCOMs.
- Subsidies & political interference: Free/under-priced electricity for certain sectors (like agriculture) burdens state finances.[93] Due to vote-bank politics, electricity prices for farmers are kept artificially low, which often leads to wasteful consumption.
Consumption
- Quality of supply: While India has achieved 100% household electrification, most households, especially in rural areas, find the electricity supply intermittent and unreliable.[94]
See also
- Energy in India
- Energy policy of India
- Oil and gas industry in India
- Climate change in India – Emissions, effects and responses of India related to climate change
- East West Gas Pipeline – Natural gas pipeline project
- List of electricity organisations in India
- Central Electricity Authority – Indian statutory organization
- List of power stations in India
- Indian Rivers Inter-link – Project to interlink rivers in India
- List of countries by electricity production
References
- ^ "Steps taken to achieve 100 per cent electrification of all households in the country".
- ^ "Average electricity supply in rural areas has increased from 12.5 hours in 2014 to 22.6 hours in 2025, and in urban areas to 23.4 hours in 2025".
- ^ "Broad Overview of Monthly Renewable Energy Generation" (PDF).
- ^ "CO2 Baseline Database for the Indian Power Sector" (PDF).
- ^ "Major Highlights".
- ^ a b c d e f g h i Authority, Central Electricity. "Growth of electricity sector in India, 1947-2024". Central Electricity Authority. Retrieved 16 August 2024.
- ^ "Understand Energy in India | Understand Energy Learning Hub". understand-energy.stanford.edu. Retrieved 7 June 2026.
- ^ a b https://cea.nic.in/wp-content/uploads/resd/2026/03/Monthly_RE_Generation_report_March_2026.pdf
- ^ https://www.businessworld.in/article/india-s-power-consumption-rises-11-5-in-may-peak-demand-hits-record-270-8-gw-609029
- ^ Authority, Central Electricity. "Installed Capacity Report - Central Electricity Authority". Central Electricity Authority.
- ^ a b "India's Stand at COP-26". www.pib.gov.in.
- ^ "History". www.cesc.co.in.
- ^ Mukherjee, Shivaji. "Sidrapong Hydel Power Station". www.wbpower.nic.in.
- ^ [1]
- ^ "History".
- ^ "Prime Minister to Dedicate Raichur-Sholapur 765 kV Single Circuit Line". www.pib.gov.in. Retrieved 7 June 2026.
- ^ a b https://static.pib.gov.in/WriteReadData/specificdocs/documents/2025/feb/doc2025221507201.pdf
- ^ a b "Installed Capacity Report - Central Electricity Authority". Archived from the original on 16 March 2021. Retrieved 7 June 2026.
- ^ https://cea.nic.in/wp-content/uploads/pdm/2025/11/Growth_Book_2025.pdf
- ^ "2025 Marks Highest-Ever Renewable Energy Expansion in India's Energy Transition Journey". Press Information Bureau, India. 29 December 2025. Archived from the original on 7 February 2026. Retrieved 1 February 2026.
- ^ www.ETEnergyworld.com. "India overtakes Japan with fifth-largest hydropower capacity in the world". ETEnergyworld.com. Retrieved 11 April 2026.
- ^ Sharma, Nihi (8 April 2026). "India Ranks third globally in Renewable Energy Installed Capacity: Shri Pralhad Joshi". Press Information Bureau. Archived from the original on 10 April 2026.
- ^ "Monthly Installed Capacity Report as on 31.03.2026" (PDF). cea.nic.in. Central Electricity Authority (India). Retrieved 15 April 2026.
- ^ "All India Electricity Statistics - General Review 2025" (PDF). Archived from the original (PDF) on 16 May 2026.
- ^ "Annual Generation Report - Central Electricity Authority". Central Electricity Authority.
- ^ Authority, Central Electricity. "General Review Report - Central Electricity Authority". Central Electricity Authority.
- ^ a b c d e f "Growth of Electricity Sector in India From 1947-2016" (PDF). May 2016. Archived from the original (PDF) on 17 February 2017.
- ^ a b c d "Renewable Energy Overview" (PDF). March 2018.
- ^ "Year wise Cumulative Generation of RE in MU" (PDF). Archived from the original (PDF) on 13 March 2025.
- ^ "Monthly Renewable Energy Generation Report" (PDF). March 2020. Archived from the original (PDF) on 2 February 2026.
- ^ "Monthly Renewable Energy Generation Report" (PDF). March 2021. Archived from the original (PDF) on 5 March 2026.
- ^ "Monthly Renewable Energy Generation Report" (PDF). March 2022. Archived from the original (PDF) on 17 June 2022.
- ^ a b "Broad Overview of Monthly Renewable Energy Generation" (PDF). March 2023. Archived from the original (PDF) on 29 February 2024.
- ^ "Broad Overview of Monthly Renewable Energy Generation" (PDF). March 2024. Archived from the original (PDF) on 4 July 2024.
- ^ a b Authority, Central Electricity. "Growth of Electricity Sector in India (1947-2025) - Central Electricity Authority" (PDF). Central Electricity Authority.
- ^ a b "Broad Overview of Monthly Renewable Energy Generation" (PDF). March 2025. Archived from the original (PDF) on 31 January 2026.
- ^ "Category Wise- Fuel Wise utility electricity Generation. Daily Report of 31-Mar-2026" (PDF). 31 March 2026.
- ^ "Monthly RE Generation Report, CEA, March 2026" (PDF). 31 March 2026.
- ^ "Coal Demand Likely to Peak Between 2030-2035". December 2022.
- ^ "20268.17 MU generated by Gas-based Power Stations during April-Jan in FY 2022-23". March 2023.
- ^ "Nuclear Power in Union Budget 2025-26". February 2025.
- ^ a b "Report on optimal generation mix 2030 version 2.0" (PDF). April 2023. Archived from the original (PDF) on 14 May 2023.
- ^ "Revised Biomass Policy mandates 5% biomass co-firing in Thermal Power Plants from FY 2024-25: Union Minister for Power and New & Renewable Energy". www.pib.gov.in.
- ^ "Advisory on co-locating Energy Storage Systems with Solar Power Projects to enhance grid stability and cost efficiency reg" (PDF). 18 February 2025. Archived from the original (PDF) on 19 February 2025.
- ^ a b c "National Electricity Plan (Volume I) - Generation" (PDF). Archived from the original (PDF) on 14 July 2024.
- ^ https://cea.nic.in/wp-content/uploads/pumpedstorage/2025/09/PSP_Potential.pdf
- ^ "Capacity Addition Plan of PSPs till 2035-36" (PDF). Archived from the original (PDF) on 8 October 2025.
- ^ "Energy Storage: Connecting India to Clean Power on Demand" (PDF). Archived (PDF) from the original on 29 December 2023. Retrieved 28 December 2023.
- ^ "Solar storage tariff spells trouble for coal". Archived from the original on 13 February 2020. Retrieved 10 February 2020.
- ^ "Cabinet approves the Scheme titled Viability Gap Funding for development of Battery Energy Storage Systems (BESS)".
- ^ "Press Release Page | Press Information Bureau". www.pib.gov.in. Retrieved 7 June 2026.
- ^ "Rethinking India's solar strategy: Why solar thermal deserves a second look". September 2025.
- ^ a b "CEA annual report 2023-24" (PDF). Archived from the original (PDF) on 15 December 2025.
- ^ "Power System | Government of India | Ministry of Power".
- ^ a b https://powermin.gov.in/sites/default/files/uploads/National_Electricity_Plan_Volume_II_Transmission.pdf
- ^ "Power distribution privatisation: The why comes first, the how comes later". May 2025.
- ^ "Why the central government should stop funding the power distribution sector". December 2022.
- ^ "Press Release: Press Information Bureau". www.pib.gov.in. Retrieved 7 June 2026.
- ^ "13th Annual integrated rating & ranking: Power distribution utilities" (PDF). April 2025. Archived from the original (PDF) on 6 August 2025.
- ^ https://web.archive.org/web/20170217223547/http://www.cea.nic.in/reports/others/planning/pdm/growth_2016.pdf
- ^ a b c "Growth of electricity sector in India from 1947-2024" (PDF). Archived from the original (PDF) on 13 September 2024.
- ^ "Ministry of New and Renewable Energy, Physical Progress (Achievements)". Archived from the original on 3 May 2018.
- ^ "Electricity use surges to all-time high in India". June 2025.
- ^ "Steps taken to achieve 100 per cent electrification of all households in the country". www.pib.gov.in. Archived from the original on 30 April 2025. Retrieved 9 December 2025.
- ^ "Average electricity supply in rural areas has increased from 12.5 hours in 2014 to 22.6 hours in 2025, and in urban areas to 23.4 hours in 2025: Shri Manohar Lal". www.pib.gov.in. Archived from the original on 22 February 2025. Retrieved 9 December 2025.
- ^ "HOUSEHOLDS ELECTRIFIED UNDER SAUBHAGYA". www.pib.gov.in. Archived from the original on 12 March 2025. Retrieved 9 December 2025.
- ^ "Greening the green revolution - A model for India's clean energy programme for agriculture". July 2023.
- ^ https://powermin.gov.in/sites/default/files/uploads/National_Electricity_Plan_Volume_II_Transmission.pdf
- ^ "India and Sri Lanka sign MoU for solar projects and HVDC interconnections - Power Line Magazine". powerline.net.in. Retrieved 7 June 2026.
- ^ https://webcdn.grid-india.in/files/grdw/2025/05/Monthly_Report_Mar_2025_317.pdf
- ^ https://webcdn.grid-india.in/files/grdw/2026/05/Monthly_Report_March_2026_704.pdf
- ^ "India loses $86 billion annually to power sector distortions: World Bank". Archived from the original on 17 December 2018. Retrieved 17 December 2018.
- ^ "Functions - Central Electricity Authority". Central Electricity Authority.
- ^ "Introduction | MINISTRY OF NEW AND RENEWABLE ENERGY | India".
- ^ "::: Central Electricity Regulatory Commission :::".
- ^ https://cea.nic.in/wp-content/uploads/annual_reports/2024/AMMR_2024_25.pdf
- ^ "Explained: What is market coupling in power sector, and how it will change electricity pricing in India". July 2025.
- ^ a b c d "CO2 Baseline Database for the Indian Power Sector - User Guide" (PDF). December 2024. Archived from the original (PDF) on 20 March 2025.
- ^ "Thermal Power Plants" (PDF). Archived from the original (PDF) on 13 July 2018.
- ^ a b "Thermal Plant Emission Notification" (PDF). December 2015. Archived from the original (PDF) on 1 February 2021.
- ^ "Experts flag dilution of NOx emission limit for coal-fired power stations". July 2020.
- ^ "Directions under Section 5 of the Environment (Protection) Act, 1986 regarding compliance of emission 1limit notified vide notification - No.S.O.3305 (E) dated 07.12.2015 – reg" (PDF). Archived from the original (PDF) on 25 November 2020.
- ^ a b c d "Insert title here".
- ^ a b c "Notification" (PDF). 30 December 2024. Archived from the original (PDF) on 10 February 2025.
- ^ a b "Environment Ministry exempts 78% of coal plants from installing key anti-polluting systems". July 2025.
- ^ a b "It is imperative to improve water efficiency in India's coal-fired thermal power plants". May 2023.
- ^ "India - fourth biennial update report to the United Nations Framework Convention on Climate Change" (PDF). Archived from the original (PDF) on 14 January 2025.
- ^ "India's Updated First Nationally Determined Contribution Under Paris Agreement" (PDF). Archived from the original (PDF) on 1 September 2022.
- ^ "Study projects losses in India's solar power potential due to air pollution, climate change". March 2025.
- ^ "India Climate & Energy Dashboard | Niti Aayog | Vasudha Foundation". iced.niti.gov.in. Retrieved 9 December 2025.
- ^ "India Climate & Energy Dashboard | Niti Aayog | Vasudha Foundation". iced.niti.gov.in. Retrieved 9 December 2025.
- ^ "India Climate & Energy Dashboard | Niti Aayog | Vasudha Foundation". iced.niti.gov.in. Retrieved 9 December 2025.
- ^ "Power Minister RK Singh warns of debt trap for using borrowed money to provide free electricity". April 2024.
- ^ "Indian villages are 100% electrified, but what's next?". February 2024.
External links
- National electricity Plan – 2012, CEA, Government of India
- Electricity grid maps of the southern region Archived 31 July 2021 at the Wayback Machine
- India's Energy Policy and Electricity Production
- [2] Archived 6 April 2019 at the Wayback Machine
Electricity sector in Asia | |
|---|---|
| Sovereign states |
|
| States with limited recognition |
|
| Dependencies and other territories |
|
| |


 Energy ministries and departments of India Energy ministries and departments of India | |||||||||||||
|---|---|---|---|---|---|---|---|---|---|---|---|---|---|
| Power |
|  | |||||||||||
| New and Renewable Energy |
| ||||||||||||
| Ministry of Coal |
| ||||||||||||
| Petroleum and Natural Gas |
| ||||||||||||
| Department of Atomic Energy |
| ||||||||||||
| Companies |
|
|---|---|
| Governance |
|
| Currency |
|
| Financial services |
|
| History |
|
| People |
|
| By state | |
| Sectors |
|
| Regulator | |
| Other |
|
| |


Electricity delivery | |||||
|---|---|---|---|---|---|
| Concepts |
|  | |||
| Sources |
| ||||
| Generation |
| ||||
Transmission and distribution |
| ||||
| Failure modes |
| ||||
Protective devices |
| ||||
Economics and policies |
| ||||
Statistics and production |
| ||||
| |||||