Global Peace Index
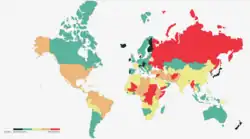
The Global Peace Index (GPI) is a report produced by the Australia-based NGO Institute for Economics & Peace (IEP) which measures the relative position of nations' and regions' peacefulness.[2] The GPI ranks 163 independent states and territories (collectively accounting for 99.7 per cent of the world's population) according to their levels of peacefulness. In the past decade, the GPI has presented trends of increased global violence and less peacefulness.[3]
The GPI (Global Peace Index) is developed in consultation with an international panel of peace experts from peace institutes and think tanks with data collected by the Economist Intelligence Unit. The index was first launched in 2007,[1] with subsequent reports being released annually. In 2015 it ranked 165 countries, up from 121 in 2007. The study was conceived by Australian technology entrepreneur Steve Killelea, and is endorsed by individuals such as former UN Secretary-General Kofi Annan, the Dalai Lama, and 2008 Nobel Peace Prize laureate Martti Ahtisaari. The updated index is released each year at events in London, Washington, D.C., and at the United Nations Secretariat in New York City.
The 2026 GPI indicates Iceland, New Zealand, Switzerland, Slovenia, Ireland, Austria, Portugal, and Singapore to be the most peaceful countries, and Russia, Sudan, the Democratic Republic of the Congo, Ukraine, Israel, South Sudan, Afghanistan, Yemen, Syria, Mali, Somalia, Pakistan, Myanmar, and the Central African Republic to be the least peaceful.[4] Among the top 7 most populous nations accounting for over half of the world's population and approximately half of the total GDP of the world, Indonesia ranks 69th overall on the Global Peace Index, China 118th, Brazil 124th, India 127th, the United States 134th, Nigeria 142nd and Pakistan 152nd.[4] Findings of the 2026 GPI indicate that the world became less peaceful for the 15th time in the last 18 years, with the average level of country peacefulness deteriorating by 0.7 per cent over the prior year.[5]
Ten indicators broadly assess what might be described as safety and security in society. Their assertion is that low crime rates, minimal incidences of terrorist acts and violent demonstrations, harmonious relations with neighbouring countries, a stable political scene, and a small proportion of the population being internally displaced or refugees can be suggestive of peacefulness.[6]
Methodology
Indicators of peacefulness
In 2017, 23 indicators were used to establish peacefulness scores for each country. The indicators were originally selected with the assistance of an expert panel in 2007 and are reviewed by the expert panel on an annual basis. The scores for each indicator are normalised on a scale of 1–5, whereby qualitative indicators are banded into five groupings, and quantitative ones are scored from 1–5, to the third decimal point. A table of the indicators is below.[7] In the table, UCDP stands for the Uppsala Conflict Data Program maintained by the University of Uppsala in Sweden, EIU for The Economist Intelligence Unit, UNSCT for the United Nations Survey of Criminal Trends and Operations of Criminal Justice Systems, ICPS is the International Centre for Prison Studies at King's College London, IISS for the International Institute for Strategic Studies publication The Military Balance, and SIPRI for the Stockholm International Peace Research Institute Arms Transfers Database.
| Indicator | Source | Coding |
|---|---|---|
| Number and duration of internal conflicts[a] | UCDP, IEP | Total number |
| Number of deaths from external organized conflict | UCDP Armed Conflict Dataset | Total number |
| Number of deaths from internal organized conflict | International Institute for Strategic Studies, Armed Conflict Database | Total number |
| Number, duration, and role in external conflicts | UCDP Battle-related Deaths Dataset, IEP | Total number |
| Intensity of organized internal conflict | EIU | Qualitative scale, ranked 1 to 5 |
| Relations with neighbouring countries | EIU | Qualitative scale, ranked 1 to 5 |
| Level of perceived criminality in society | EIU | Qualitative scale, ranked 1 to 5 |
| Number of refugees and displaced persons as percentage of population | UNHCR and IDMC | Refugee population by country or territory of origin, plus the number of a country's internally displaced people (IDP's) as a percentage of the country's total population |
| Political instability | EIU | Qualitative scale, ranked 1 to 5 |
| Impact of terrorism | Global Terrorism Index (IEP) | Quantitative scale, ranked 1 to 5 |
| Political terror | Amnesty International and US State Department | Qualitative scale, ranked 1 to 5 |
| Number of homicides per 100,000 people | UNODC Surveys on Crime Trends and the Operations of Criminal Justice Systems (CTS); EIU estimates | Total number |
| Level of violent crime | EIU | Qualitative scale, ranked 1 to 5 |
| Likelihood of violent demonstrations | EIU | Qualitative scale, ranked 1 to 5 |
| Number of jailed persons per 100,000 people | World Prison Brief, Institute for Criminal Policy Research at Birkbeck, University of London | Total number |
| Number of internal security officers and police per 100,000 people | UNODC CTS; EIU estimates | Total number; Civil police force distinct from national guards or local militia[b] |
| Military expenditure as a percentage of GDP | The Military Balance and IISS | Cash outlays of central or federal government to meet costs of national armed forces, as a percentage of GDP, scores from 1 to 5 based on percentages[c] |
| Number of armed-services personnel per 100,000 | The Military Balance and IISS | All full-time active armed-services personnel |
| Volume of transfers of major conventional weapons as recipient (imports) per 100,000 people | SIPRI Arms Transfers Database | Imports of major conventional weapons per 100,000 people[d] |
| Volume of transfers of major conventional weapons as supplier (exports) per 100,000 people | SIPRI Arms Transfers Database | Exports of major conventional weapons per 100,000 people |
| Financial contribution to UN peacekeeping missions | United Nations Committee on Contributions and IEP | Percentage of countries' "outstanding payments versus their annual assessment to the budget of the current peacekeeping missions" over an average of three years, scored from 1–5 scale based on percentage of promised contributions met |
| Nuclear and heavy weapons capability | The Military Balance, IISS, SIPRI, UN Register of Conventional Arms and IEP | 1–5 scale based on accumulated points; 1 point per armoured vehicle and artillery pieces, 5 points per tank, 20 points per combat aircraft, 100 points per warship, 1000 points for aircraft carrier and nuclear submarine[e] |
| Ease of access to small arms and light weapons | EIU | Qualitative scale, ranked 1 to 5 |
Indicators not already ranked on a 1 to 5 scale were converted by using the following formula: x = [x - min(x)] / [max(x) - min(x)], where max(x) and min(x) are the highest and lowest values for that indicator of the countries ranked in the index. The 0 to 1 scores that resulted were then converted to the 1 to 5 scale. Individual indicators were then weighted according to the expert panel's judgment of their importance. The scores were then tabulated into two weighted sub-indices: internal peace, weighted at 60% of a country's final score, and external peace, weighted at 40% of a country's final score. "Negative Peace", defined as the absence of violence or of the fear of violence, is used as the definition of peace to create the Global Peace Index. An additional aim of the GPI database is to facilitate deeper study of the concept of positive peace, or those attitudes, institutions, and structures that drive peacefulness in society. The GPI also examines relationships between peace and reliable international measures, including democracy and transparency, education and material well-being. As such, it seeks to understand the relative importance of a range of potential determinants, or "drivers", which may influence the nurturing of peaceful societies, both internally and externally.[8]
Statistical analysis is applied to GPI data to uncover specific conditions conducive of peace. Researchers have determined that Positive Peace, which includes the attitudes, institutions, and structures that pre-empt conflict and facilitate functional societies, is the main driver of peace. The eight pillars of positive peace are well-functioning government, sound business environment, acceptance of the rights of others, good relations with neighbours, free flow of information, high levels of human capital, low levels of corruption, and equitable distribution of resources. Well-functioning government, low levels of corruption, acceptance of the rights of others, and good relations with neighbours are more important in countries suffering from high levels of violence. Free flow of information and sound business environment become more important when a country is approaching the global average level of peacefulness, also described as the Mid-Peace level. Low levels of corruption is the only Pillar that is strongly significant across all three levels of peacefulness. This suggests it is an important transformational factor at all stages of a nation's development.
Potential issues
According to The Economist, the weighting of military expenditure "may seem to give heart to freeloaders: countries that enjoy peace precisely because others (often the USA) care for their defence".[9] The Global Peace Index has been criticized for not including indicators specifically relating to violence against women and children.[10]
Conceptual criticism
Johan Galtung, in a 2016 editorial titled "Charlatanism: 'The Positive Peace Index'", argued that the IEP's framework omits structural violence and accordingly classifies "societies-regions-worlds so repressive that violence is not needed" as peaceful.[11] In his earlier papers, he defined positive peace and negative peace, as well as the concept structural violence. He and other researchers considered economic blockades and sanctions an insidious form of structure violence.[12][13]
Extending this line of criticism, peace researchers Peter T. Coleman and Kyong Mazzaro identified in 2013 a fundamental measurement asymmetry in the GPI: both the original GPI and the later Positive Peace Index (PPI) overwhelmingly measure the absence of negative conditions rather than the presence of positive ones.[14] A coding of the PPI indicators found that 73 per cent measured negative conditions (e.g., crime victimisation, homicide rates, perceived discrimination) while only 27 per cent assessed positive ones; combined with the GPI, the negative-to-positive ratio approached 7:1. Coleman and Mazzaro argued that decades of research in peace psychology, including John Gottman's findings that the predictors of divorce and the predictors of marital happiness are qualitatively distinct, and the authors' own studies of Israeli and Palestinian motivations, demonstrate that the drivers of sustainable peace are fundamentally different from the inverse of the drivers of violence. They proposed that sustainable peace be measured through a framework that tracks both the decreasing probability of destructive conflict and the increasing probability of cooperation, justice, and well-being, drawing on evidence that social systems thrive when the ratio of positive to negative dynamics exceeds approximately 3:1 to 5:1.[14]
A second concern raised by the same authors is the GPI's dominant economic lens. They observed that roughly half of the PPI's indicators are linked to the IEP's concept of a "Peace Industry" (metrics such as economic growth, consumer spending, and sound business environment) and noted that while commercial liberalism shows some correlation with reduced interstate conflict, economic openness does not significantly reduce internal conflict. Research indicates that horizontal inequalities (the intersection of political, social, and economic disparities) are a better predictor of civil rebellion than income level alone.[14]
Methodological criticism
The methodology used to construct and rank the Global Peace Index does not deal with positive peace. In addition, it may face criticism due to the following:
- Reproducibility issue: five of the 23 indicators are not measured but are qualitative judgments assigned by anonymous analysts; many of the remaining 18 quantitative indicators depend on internally imputed values. Because the scoring practices of these analysts and imputation procedures are not fully disclosed, independent researchers cannot reproduce or verify these scores, effectively making the index a "closed-source human model". Relatedly, the GPI operates at the national level of analysis, which—while feasible for a global index—neglects significant sub-national variation in peacefulness across regions, communities, and cities, and relies on data from countries that may lack the basic infrastructure to collect accurate statistics on the measured indicators.[14]
- False statistical precision and ranking artefacts: The GPI reports scores to three decimal places without any quantification of uncertainty or confidence intervals, importing more precision than the underlying data (such as estimated conflict deaths or subjective estimate of political stability) can support. [15]
- Subjective or somewhat arbitrary selection or weighting of the factors[16]: In computing the index, relevant factors (for the instigators) are not meaningfully counted, such as imposition of economic blockade or sanctions that negatively impact human development or regional stability, troops stationed or deployed abroad for war preparations, assassinations conducted in neighboring countries, participation in foreign regime changes, proxy wars, and covert actions. Nair noted in 2016 that small, stable and democratic countries are most peaceful according to GPI, and most of them are western or central European democracies. [17] Swanson noted in 2022 that five of the 10 most “peaceful” nations on Earth were NATO members. [16]
Data consistency
The 2026 GPI report includes some 2026 data, but most indicators draw on data from 2025 or earlier. Although the report mentions the Iran War (which began on 28 February 2026) dozens of times across multiple chapters[18] and includes a dedicated subchapter on its economic impact,[19] the Index itself does not fully capture this conflict. The report notes that "the full impact of the Iran war is not captured by the Index this year"[5] and that Israel's improvement "does not take into account the Iran war that started in late February 2026".[20] Country-level relations indicators are updated only to the end of March 2026, leaving most 2026 events outside the scoring window.
It is also often not clear which data are obtained from direct surveys and which from imputation. Appendix A states that IEP uses "multivariate imputation by chained equations to create country-level estimates" when official data are missing,[21] but the assumptions underlying these imputations—particularly the missing-data mechanism (MCAR, MAR, or MNAR)—are not explicitly discussed in the main body of the report.
Assumptions
Despite devoting a full chapter to the "Economic Impact of Violence",[22] none of the 23 GPI indicators directly measures human injuries, suffering, or the direct economic cost of war (such as infrastructure destruction or conflict-related healthcare expenditure). The Index instead operationalises peace as the absence of violence through structural and institutional indicators (military expenditure, weapons transfers, political stability, etc.). As a result, a country can be actively engaged in sustained military conflict yet still register an overall score improvement if other indicator domains move favourably.
The 2026 GPI illustrates this limitation: Israel's overall score improved by 2.6 per cent,[20] driven mostly by improvements in the Militarisation domain and selected conflict indicators,[20] even as the country remained engaged in the protracted Gaza campaign (entering its third year), the June 2025 Twelve-Day War with Iran, and renewed conflict with Hezbollah in early 2026.[23] The human costs—including tens of thousands of civilian casualties[24][10] and large-scale infrastructure damage—fall largely outside the 23-indicator framework. This structural omission may partly explain why a country at war can nonetheless achieve an improved peacefulness score.
The 2026 GPI also reported a contrasting case: China's ranking dropped by 11 positions while the country maintained peaceful relations with neighbouring countries and was not engaged in any active armed conflict during the scoring period[4]; it reportedly played a key role in facilitating the Iran war ceasefire back in early April along with Pakistan.[25][26] The narrative that Israel's peacefulness improved by one position while engaged in multiple wars, at the same time that China's peacefulness declined substantially while at relative peace with its neighbours, has not been corroborated by any other published empirical and independent research in the field of peace and conflict studies. The curious conclusion derived from Table C.2 data in Appendix that Chinese society is less safe or secure than the American society in 2026 would also be difficult to replicate independently and empirically.[27]
Further research would be needed to see to what degree Global Peace Index may be susceptible to the common problems associated with composite index, such as arbitrary weightings, false precision, inconsistent standards, hidden methodologies, misleading comparisons.[15] Global Peace Index 2026 itself did not mention if uncertainty analysis and sensitivity analysis have been performed as advised by OECD Handbook on Constructing Composite Indicators[28][29] to test robustness of the index across the 163 countries.
Global Peace Index ranking
Legend
- Very high state of peace
- High state of peace
- Medium state of peace
- Low state of peace
- Very low state of peace
| Rank | Country | Score | Change |
|---|---|---|---|
| 1 |  Iceland Iceland
|
1.161 | 
|
| 2 |  New Zealand New Zealand
|
1.343 |  1 1
|
| 3 | .svg.png) Switzerland Switzerland
|
1.363 |  1 1
|
| 4 |  Slovenia Slovenia
|
1.369 | 2
|
| 5 |  Ireland Ireland
|
1.371 | 1
|
| 6 |  Austria Austria
|
1.421 | 1
|
| 7 | .svg.png) Portugal Portugal
|
1.427 | 1
|
| 8 |  Singapore Singapore
|
1.435 | 1
|
| 9 |  Finland Finland
|
1.478 | 1
|
| 10 |  Japan Japan
|
1.489 | 3
|
| 11 |  Denmark Denmark
|
1.504 | 2
|
| 12 |  Malaysia Malaysia
|
1.513 | 1
|
| 13 |  Czech Republic Czech Republic
|
1.517 | 1
|
| 14 | .svg.png) Canada Canada
|
1.525 | 1
|
| 15 |  Hungary Hungary
|
1.538 | 1
|
| 16 |  Bhutan Bhutan
|
1.546 | 2
|
| 17 |  Netherlands Netherlands
|
1.566 |
|
| 18 |  Mauritius Mauritius
|
1.586 | 11
|
| 19 |  Latvia Latvia
|
1.589 |
|
| 20 | .svg.png) Australia Australia
|
1.602 | 4
|
| 21 | .svg.png) Belgium Belgium
|
1.608 | 5
|
| 22 |  Poland Poland
|
1.615 | 23
|
| 23 |  Croatia Croatia
|
1.619 | 2
|
| 24 |  Lithuania Lithuania
|
1.62 | 3
|
| 25 |  Estonia Estonia
|
1.623 | 5
|
| 26 |  Bulgaria Bulgaria
|
1.628 | 4
|
| 27 |  Spain Spain
|
1.654 | 4
|
| 28 |  Germany Germany
|
1.657 | 5
|
| 29 |  Slovakia Slovakia
|
1.661 | 3
|
| 30 |  Montenegro Montenegro
|
1.672 | 2
|
| 31 |  Qatar Qatar
|
1.676 | 10
|
| 32 |  Timor-Leste Timor-Leste
|
1.681 | 2
|
| 33 |  Norway Norway
|
1.688 |
|
| 34 |  Mongolia Mongolia
|
1.692 | 4
|
| 35 |  Italy Italy
|
1.712 |
|
| 36 |  Albania Albania
|
1.725 | 7
|
| 37 |  Uzbekistan Uzbekistan
|
1.726 | 10
|
| 38 |  Equatorial Guinea Equatorial Guinea
|
1.729 | 20
|
| 39 | .svg.png) United Kingdom United Kingdom
|
1.73 | 7
|
| 40 |  Sweden Sweden
|
1.732 | 1
|
| 41 |  Vietnam Vietnam
|
1.738 | 1
|
| 42 |  Taiwan Taiwan
|
1.751 | 5
|
| 43 |  Uruguay Uruguay
|
1.754 | 1
|
| 44 |  Kazakhstan Kazakhstan
|
1.771 | 5
|
| 45 |  Romania Romania
|
1.788 | 1
|
| 46 |  North Macedonia North Macedonia
|
1.792 | 3
|
| 47 |  Tajikistan Tajikistan
|
1.799 | 6
|
| 48 |  Bosnia and Herzegovina Bosnia and Herzegovina
|
1.81 | 9
|
| 49 |  Kuwait Kuwait
|
1.813 | 13
|
| 50 |  Botswana Botswana
|
1.823 | 4
|
| 51 |  Armenia Armenia
|
1.825 | 21
|
| 52 |  Chile Chile
|
1.826 | 8
|
| 53 |  Greece Greece
|
1.828 | 2
|
| 54 |  Kosovo Kosovo
|
1.83 |
|
| 55 |  Moldova Moldova
|
1.836 | 1
|
| 56 |  Gambia Gambia
|
1.837 | 5
|
| 57 |  South Korea South Korea
|
1.839 | 6
|
| 58 |  Laos Laos
|
1.846 |
|
| 59 |  Madagascar Madagascar
|
1.849 | 4
|
| 60 |  Oman Oman
|
1.85 | 26
|
| 61 |  Kyrgyzstan Kyrgyzstan
|
1.853 | 8
|
| 62 |  Costa Rica Costa Rica
|
1.86 | 14
|
| 63 |  Namibia Namibia
|
1.872 | 1
|
| 64 |  Paraguay Paraguay
|
1.882 | 5
|
| 65 |  Morocco Morocco
|
1.887 | 3
|
| 66 |  Turkmenistan Turkmenistan
|
1.903 | 2
|
| 67 |  Sri Lanka Sri Lanka
|
1.91 | 14
|
| 68 |  Jordan Jordan
|
1.913 | 9
|
| 69 |  Indonesia Indonesia
|
1.918 | 3
|
| 2=70 |  Jamaica Jamaica
|
1.919 | 1
|
| 2=70 |  Serbia Serbia
|
1.919 | 5
|
| 72 |  Argentina Argentina
|
1.922 | 20
|
| 73 |  United Arab Emirates United Arab Emirates
|
1.927 |
|
| 74 |  Sierra Leone Sierra Leone
|
1.937 | 9
|
| 75 |  Senegal Senegal
|
1.939 | 12
|
| 76 |  Ghana Ghana
|
1.943 | 2
|
| 77 |  Tunisia Tunisia
|
1.947 | 19
|
| 78 |  Angola Angola
|
1.955 | 11
|
| 79 |  Trinidad and Tobago Trinidad and Tobago
|
1.959 | 12
|
| 80 |  Cyprus Cyprus
|
1.967 | 9
|
| 81 |  Panama Panama
|
1.976 | 6
|
| 82 |  Zambia Zambia
|
1.992 | 2
|
| 83 |  Malawi Malawi
|
1.994 | 18
|
| 84 |  Papua New Guinea Papua New Guinea
|
2.002 | 17
|
| 85 |  Guinea-Bissau Guinea-Bissau
|
2.012 | 7
|
| 86 |  Lesotho Lesotho
|
2.016 | 27
|
| 87 |  Liberia Liberia
|
2.024 | 17
|
| 88 |  Guatemala Guatemala
|
2.025 | 6
|
| 89 |  Dominican Republic Dominican Republic
|
2.038 | 10
|
| 90 |  Zimbabwe Zimbabwe
|
2.051 | 10
|
| 91 |  Algeria Algeria
|
2.053 | 5
|
| 92 |  Bolivia Bolivia
|
2.054 | 2
|
| 93 |  Côte d'Ivoire Côte d'Ivoire
|
2.061 | 9
|
| 94 |  Georgia Georgia
|
2.066 | 1
|
| 95 |  Saudi Arabia Saudi Arabia
|
2.067 | 2
|
| 96 |  Cambodia Cambodia
|
2.075 | 8
|
| 97 | .svg.png) Honduras Honduras
|
2.075 | 13
|
| 98 |  Tanzania Tanzania
|
2.08 | 20
|
| 99 |  France France
|
2.083 | 3
|
| 100 |  Gabon Gabon
|
2.086 | 17
|
| 101 |  Thailand Thailand
|
2.089 | 7
|
| 102 |  Philippines Philippines
|
2.092 | 3
|
| 103 |  Guyana Guyana
|
2.093 | 12
|
| 104 |  Eswatini Eswatini
|
2.095 | 6
|
| 105 |  Djibouti Djibouti
|
2.098 | 6
|
| 106 |  Nicaragua Nicaragua
|
2.107 | 9
|
| 107 |  Peru Peru
|
2.12 | 1
|
| 108 |  Bahrain Bahrain
|
2.131 |
|
| 109 |  Cuba Cuba
|
2.139 | 11
|
| 110 |  Azerbaijan Azerbaijan
|
2.142 | 8
|
| 111 |  Nepal Nepal
|
2.143 | 26
|
| 112 |  Mauritania Mauritania
|
2.184 | 2
|
| 113 |  Egypt Egypt
|
2.186 | 2
|
| 114 |  Rwanda Rwanda
|
2.2 | 2
|
| 115 |  Belarus Belarus
|
2.216 | 1
|
| 116 |  Guinea Guinea
|
2.22 | 2
|
| 117 |  Bangladesh Bangladesh
|
2.226 | 3
|
| 118 |  China China
|
2.231 | 11
|
| 119 | .svg.png) Togo Togo
|
2.251 | 7
|
| 120 |  Republic of the Congo Republic of the Congo
|
2.256 | 15
|
| 121 |  El Salvador El Salvador
|
2.264 | 1
|
| 122 |  Benin Benin
|
2.293 | 1
|
| 123 |  South Africa South Africa
|
2.308 | 4
|
| 124 |  Brazil Brazil
|
2.333 | 1
|
| 125 |  Libya Libya
|
2.361 | 3
|
| 126 |  Mozambique Mozambique
|
2.383 | 1
|
| 127 |  India India
|
2.409 | 3
|
| 128 |  Eritrea Eritrea
|
2.412 | 3
|
| 129 |  Burundi Burundi
|
2.417 | 6
|
| 130 |  Uganda Uganda
|
2.42 | 7
|
| 131 |  Lebanon Lebanon
|
2.435 | 3
|
| 132 |  Kenya Kenya
|
2.447 | 1
|
| 133 |  Venezuela Venezuela
|
2.516 | 4
|
| 134 |  United States of America United States of America
|
2.535 | 4
|
| 135 |  Ecuador Ecuador
|
2.539 | 3
|
| 136 |  Türkiye Türkiye
|
2.605 | 8
|
| 137 |  Cameroon Cameroon
|
2.634 | 5
|
| 138 |  Ethiopia Ethiopia
|
2.648 | 1
|
| 139 |  Mexico Mexico
|
2.65 | 4
|
| 140 |  Iraq Iraq
|
2.662 |
|
| 141 |  Colombia Colombia
|
2.735 | 4
|
| 2=142 |  Haiti Haiti
|
2.755 | 1
|
| 2=142 |  Nigeria Nigeria
|
2.755 | 6
|
| 144 |  Iran Iran
|
2.759 | 6
|
| 145 |  Chad Chad
|
2.769 | 9
|
| 146 |  Niger Niger
|
2.832 | 1
|
| 147 |  North Korea North Korea
|
2.845 |
|
| 148 |  Palestine Palestine
|
2.877 | 2
|
| 149 |  Burkina Faso Burkina Faso
|
2.882 | 3
|
| 150 |  Central African Republic Central African Republic
|
2.906 | 1
|
| 151 |  Myanmar Myanmar
|
2.911 | 2
|
| 152 |  Pakistan Pakistan
|
2.919 | 6
|
| 153 |  Somalia Somalia
|
2.973 | 4
|
| 154 |  Mali Mali
|
2.996 |
|
| 155 | .svg.png) Syria Syria
|
3.067 |
|
| 156 |  Yemen Yemen
|
3.081 | 2
|
| 157 |  Afghanistan Afghanistan
|
3.106 |
|
| 158 |  South Sudan South Sudan
|
3.116 | 2
|
| 159 |  Israel Israel
|
3.124 | 1
|
| 160 |  Ukraine Ukraine
|
3.184 | 2
|
| 161 |  Democratic Republic of the Congo Democratic Republic of the Congo
|
3.189 |
|
| 162 |  Sudan Sudan
|
3.195 | 3
|
| 163 |  Russia Russia
|
3.367 |
|
Note: The GPI's methodology is updated regularly and is improved to reflect the most up-to-date datasets. Each year's GPI report includes a detailed description of the methodology used. Also, the data is revised periodically and so values from previous years may change accordingly.
These tables contain the scores and ranking published in the official annual reports. The latest revised data can be found at Vision of Humanity's Interactive world map of the Global Peace Index Archived 2022-07-16 at the Wayback Machine.
Responses

The Index has received endorsements as a political project from a number of major international figures, including the former Secretary-General of the United Nations, Kofi Annan; former President of Finland and 2008 Nobel Peace Prize laureate Martti Ahtisaari; the 14th Dalai Lama; Archbishop Desmond Tutu; Muhammad Yunus; and former United States President Jimmy Carter.[32]
Jeffrey Sachs at Columbia University said: "The GPI continues its pioneering work in drawing the world's attention to the massive resources we are squandering in violence and conflict."[33] Some at Australian National University say that the GPI report presents "the latest and most comprehensive global data on trends in peace, violence and war" and "provides the world's best analysis of the statistical factors associated with long-term peace, as well as economic analysis on the macroeconomic impacts of everyday violence and war on the global economy."[34]
The impact of Global Peace Index has been lower on the academic study of war and peace than on international organizations.[35]
Previous reports
- "Reports Institute for Economics and Peace". Institute for Economics & Peace. Feb 6, 2024.
- Institute for Economics and Peace (2023). Global Peace Index 2023 (PDF). Institute for Economics & Peace. ISBN 978-0-6451494-9-4.
- "Global Peace Index 2021 Summary & Findings". Vision of Humanity. Oct 13, 2021.
- Chalabi, Mona (Jun 11, 2013). "Global peace index 2013: the full list". the Guardian.
- Rogers, Simon (May 25, 2011). "Global peace index 2011: the full list". the Guardian.
- "Global Peace Index 2009" (PDF).
See also
- Appeasement
- Global Militarisation Index
- Global Terrorism Index
- Human Development Index
- Institute for Economics and Peace
- Steve Killelea
- United Kingdom Peace Index
- United States Peace Index
- World Happiness Report
- World peace
- Interactive model of democratic peace
Notes
- ^ In this case, a conflict is defined as, "a contested incompatibility that concerns government and/or territory where the use of armed force between two parties, of which at least one is the government of a state, results in at least 25 battle-related deaths in a year."
- ^ Excludes militia and national guard forces.
- ^ This includes, "cash outlays of central or federal government to meet the costs of national armed forces—including strategic, land, naval, air, command, administration and support forces as well as paramilitary forces, customs forces and border guards if these are trained and equipped as a military force."
- ^ This includes transfers, purchases, or gifts of aircraft, armoured vehicles, artillery, radar systems, missiles, ships, engines
- ^ Rates the destructive capability of a country's stock of heavy weapons via a categorized system. As of 2013, countries with nuclear capabilities receive a score of five, the highest possible score.
References
- ^ a b "Global Peace Index".
- ^ Institute for Economics & Peace. "Global Peace Index 2017" (PDF). visionofhumanity.org. Archived from the original (PDF) on 2019-04-01. Retrieved 2017-11-27.
- ^ Wang, Monica. "The World's Most And Least Peaceful Countries In 2016". Forbes. Archived from the original on 2019-06-18. Retrieved 2017-11-26.
- ^ a b c "2026 Global Peace Index" (PDF). Institute for Economics & Peace. Institute for Economics & Peace. June 2026. Retrieved 2026-06-10.
- ^ a b IEP, Global Peace Index 2026, p. 14.
- ^ "INDEX", The Christology of Erasmus, Catholic University of America Press, pp. 293–302, 2024-01-26, doi:10.2307/jj.10677887.15, ISBN 978-0-8132-3803-6, retrieved 2024-06-17
{{citation}}: CS1 maint: work parameter with ISBN (link) - ^ Information about indicators and methodology "2013 Global Peace Index"(PDF). Institute for Economics and Peace. Archived from the original (PDF) on 2013-12-10. Retrieved 2013-06-24.
- ^ Institute for Economics and Peace. "Global Peace Index Report, Methodology, pg. 113–136" (PDF). Visionofhumanity.org. Archived from the original (PDF) on 2019-04-01. Retrieved 2017-11-27.
- ^ "Give peace a rating". The Economist. 2007-05-31. ISSN 0013-0613. Retrieved 2017-11-27.
- ^ a b "Dark underbelly of the world's most 'peaceful' countries". Christian Science Monitor. 2007-07-26. ISSN 0882-7729. Retrieved 2017-11-27.
- ^ Johan Galtung (2016-07-11). "Charlatanism: "The Positive Peace Index"". Retrieved 2026-06-11.
- ^ Galtung, Johan (1969). "Violence, Peace, and Peace Research". Journal of Peace Research. 6 (3): 167–191.
- ^ Alexandra Hofer; Mohammad Kanfash (2024-06-17). "Sanctions as Violence". E-International Relations. Retrieved 2026-06-13.
- ^ a b c d Coleman, Peter T.; Mazzaro, Kyong (2013-11-27). "The Beginning of Peace?". Psychology Today. Retrieved 2026-06-14.
- ^ a b Barclay, Matthew; Dixon-Woods, Mary; Lyratzopoulos, Georgios (2019). "The problem with composite indicators". BMJ Quality & Safety. 28 (4): 338–344. doi:10.1136/bmjqs-2018-007798. PMID 30100565.
- ^ a b David Swanson (2022-07-19). "What the Global Peace Index Does and Does Not Measure". Retrieved 2026-06-10.
- ^ Nisha Velappan Nair (2016). "Constructing Indices of Peace: A Critical Reappraisal with particular Reference to Global Peace Index". Gandhi Marg Quarterly. 38 (1): 71–100.
- ^ IEP, Global Peace Index 2026, pp. 59–62.
- ^ IEP, Global Peace Index 2026, p. 59.
- ^ a b c IEP, Global Peace Index 2026, p. 21.
- ^ IEP, Global Peace Index 2026, Appendix A, pp. 107–109.
- ^ IEP, Global Peace Index 2026, Chapter 3, pp. 48–71.
- ^ IEP, Global Peace Index 2026, pp. 14–16.
- ^ Spagat, Michael; Pederson, Jon; Shikaki, Khalil; Robbins, Michael; Bendavid, Eran; Håvard, Hegre; Guha-Sapir, Debarati (18 February 2026). "Violent and non-violent death tolls for the Gaza conflict: new primary evidence from a population-representative field survey". The Lancet. 14 (4): e552–e559. doi:10.1016/S2214-109X(25)00522-4. PMID 41722607. Retrieved 18 February 2026.
- ^ "Iran War Live Updates: U.S. and Iran Agree to Cease-Fire, Avoiding Trump's Threats of Imminent Devastation". The New York Times. 2026-04-07. Retrieved 2026-04-07.
- ^ "Why Pakistan and China brokered a fragile Iran ceasefire". USA Today. 2026-04-08. Retrieved 2026-04-08.
- ^ IEP, Global Peace Index 2026, p. 113.
- ^ OECD-JRC (2008). Handbook on constructing composite indicators: Methodology and user guide, OECD Statistics working paper JT00188147, STD/DOC(2005)3.
- ^ JRC web pages on composite indicators
- ^ "2026 Global Peace Index" (PDF). Institute for Economics & Peace. Institute for Economics & Peace. June 2026. Retrieved 2026-06-10.
- ^ Vizzuality. "Resource Watch". resourcewatch.org. Retrieved 2025-03-04.
- ^ Endorsers for GPI — Vision of Humanity. Retrieved 2013-08-16.
- ^ "Global Peace Index: World Less Peaceful in 2010 Report, Violence Impacting Global Economy $7 Trillion Annually". Phil's Stock World. Retrieved 2017-11-27.
- ^ "Giving peace a chance? 2017 Global Peace Index". ANU. 2017-06-09. Retrieved 2017-11-27.
- ^ Firchow, Pamina; Ginty, Roger Mac (2017). "Measuring Peace: Comparability, Commensurability, and Complementarity Using Bottom-Up Indicators". International Studies Review. 19: 6–27. doi:10.1093/isr/vix001.
External links
- Vision of Humanity – Global Peace Index Site Archived 2018-02-24 at the Wayback Machine
- Institute for Economics and Peace Archived 2023-07-05 at the Wayback Machine
- Interactive world map of the Global Peace Index Archived 2022-07-16 at the Wayback Machine
- Integrated Research Archived 2023-08-30 at the Wayback Machine Steve Killelea is the founder of technology company Integrated Research
- Uppsala Conflict Data Program, an organized violence database
- Global Peace Index 2013: The Full List Archived 2023-03-13 at the Wayback Machine
- List of safest countries by Global Peace Index
- Vision of Humanity – Global Peace Index Site Archived 2024-6-12 at the Wayback Machine